Use Stock Charts to Check Technical Indicators
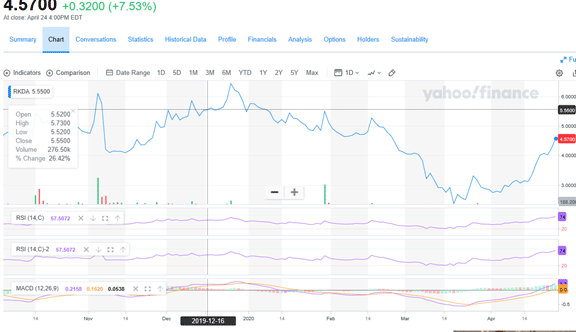
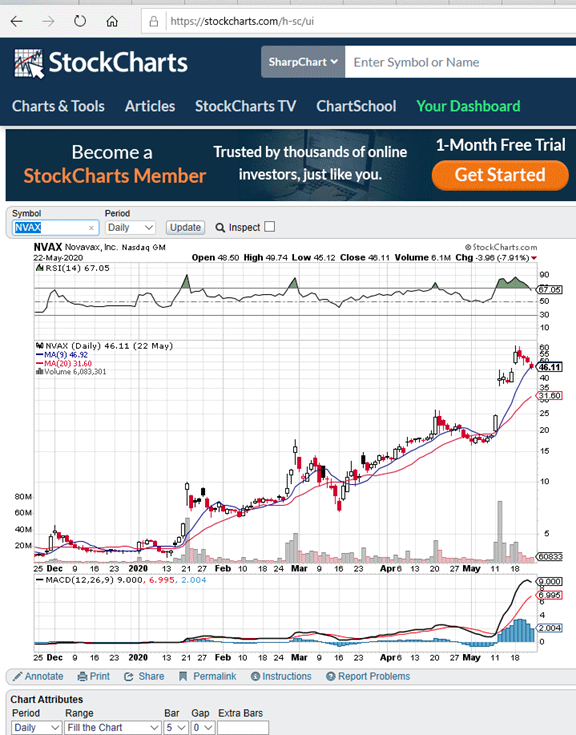
9 day moving average crossed the 20 day moving average is one of the best tools to use to help make decisions on direction in the markets and stocks. This is not the only one. You will have to use multiple tools in order to make the best decisions. I am recommending you create folders in Windows Explorer for each article. This way you organize articles. Google Stock Charts and you can use this for one of your tools.
Weekly 9MA about to cross the weekly 20MA


