Bull Market Indicators
This is an older article 08/25/2014. 10 Year Bond Yield is one of the best tools to use to help make decisions on direction in the markets and stocks. This is not the only one. You will have to use multiple tools in order to make the best decisions. I am recommending you create folders in Windows Explorer for each article. This way you organize articles. You can also learn from older articles. You can compare charts to the article to see what happened back in time. Below is link to article. Enjoy!!
Second is news flow. Colas is keeping an eye on the stream of earnings and economic announcements. The last quarter showed strong top line and bottom line growth and he wants to see a continuation of that trend in the back half. His target is 8-10% for earnings and 2-3% for GDP. This follows on the heels of second quarter GDP coming in at 4%.
Finally, Colas focuses on asset correlations, i.e., how stocks move together during a financial period. The lower the correlation, the more money investors can put into the markets. During the depths of the financial crisis correlations were extremely high– around 95%. He says “asset price correlations for sectors in the S&P should be 50. The good news is that we’re back down closer to 70% and even the pullback that we had recently only got us back to 75. So we still have some room for correlations to go down for asset owners to put money into U.S. equities.”
If investors can move beyond the Fed and interest rate fears, Colas predicts correlations should come down further.
Slok:
I believe the stock market will continue to go up until we get a recession. And we are nowhere near entering a recession. Recessions happen because of a bubble bursting in capex (as we saw on 2000) or because of a bubble bursting in consumption (as in 2008) or when monetary policy is too tight, i.e. when the fed funds rate is well above its neutral level. None of this is happening at the moment. If anything, we are seeing too little capex and consumption.
Slok says he expects “some wobbles” as the Fed begins to raise rates, but this will not derail the current economic expansion.
” I don’t think the low dealer inventory issue will be big enough to cause a recession because balance sheets in the banking sector, household sector, and corporate sector are today much stronger than they have been in a very long time,” Slok writes. “Or put differently, Fed hiking rates in 2015 will not derail the current expansion. That’s why I expect equities to continue to rise steadily over the coming years.”
So there you have it.
This, however, is just Slok’s view. The Deutsche Bank “house view,” per the firm’s equity strategy team led by David Bianco sees the S&P 500 finishing 2014 at 1,850.
On Monday, for the first time ever, the S&P 500 touched 2,000.
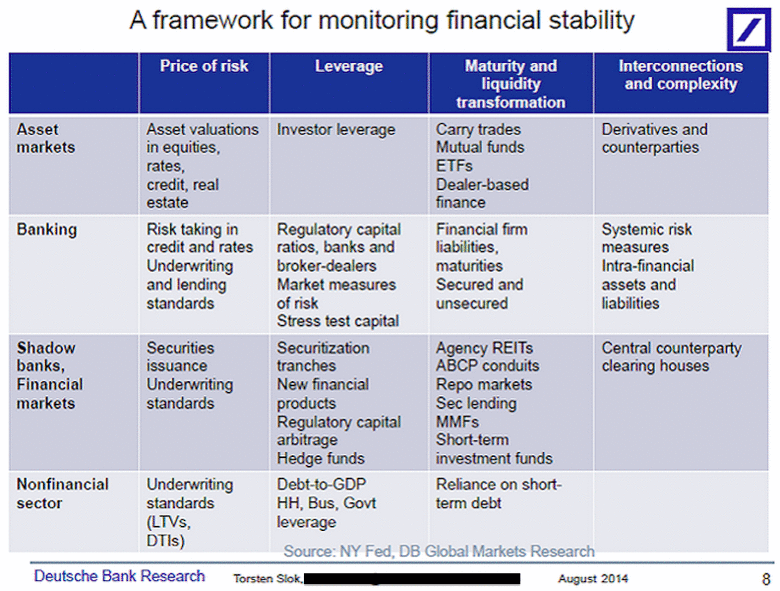
Here’s the rubric for financial stability from Deutsche Bank, which right now is showing “no signs of significant systemic risk in the financial system.”
View gallery

Citi’s Tom Fitzpatrick
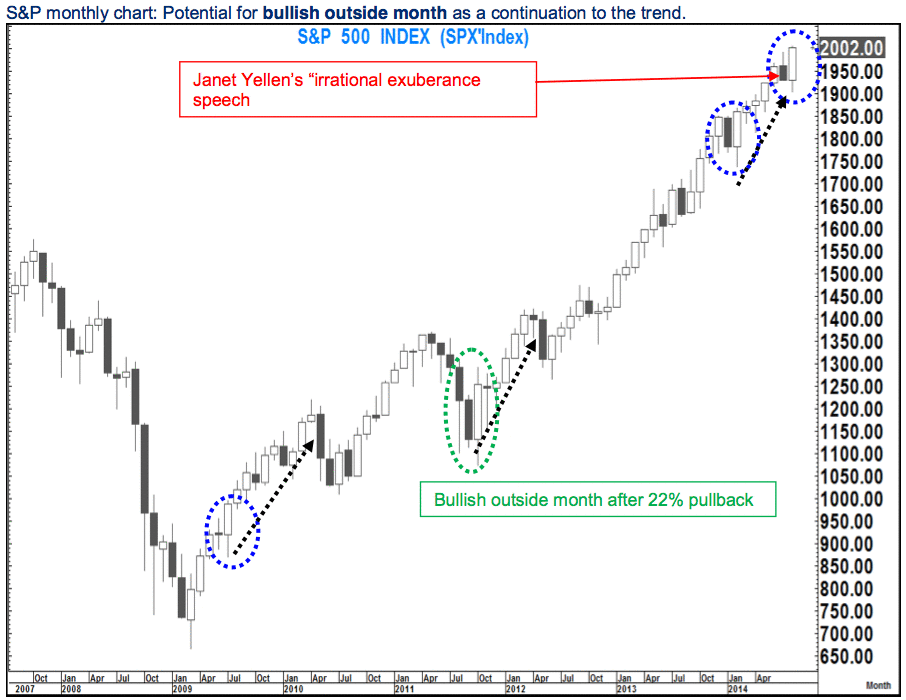
This week, we saw the S&P 500 finish over 2,000 for the first time ever. This is a whopping 200% gain from its March 2009 low.
Tom Fitzpatrick and the technical analysis team at Citi see a chance for this rally to keep going, moving “towards at least 2,150-2,250” and “possibly 2,350-2,400 into Q1, 2015.”
The team at Citi looked at trading in the S&P 500 earlier this year, and thinks the five months of gains that followed the 6% decline seen January-February could portend a similar rise in the S&P following the 4% “hiccup” in July.
The basic setup, as the Citi team sees it, is that August could be another month like those seen in July 2009, October 2011, and February 2014, where market gains outpace the decline seen during the previous month. This is known as an “outside bullish” month.
If this pattern holds, which Citi says would be the case if the S&P closes over 1,991 on Friday, prior rallies indicate the S&P could be headed to 2,150-2,250.
View gallery

Citi
So now, we wait.

